Data Humanism
Data visualizations are created for people and by people, often comprised of information about people. Yet, computer-generated information design all too often appears objective, sterile, and detached from social processes. My work in data humanism seeks to foreground the role of the person (me) collecting and visualizing the data.
This is the key for the above design reflecting my personal data on distractions. For a week, I logged every time I caught myself being distracted. The smaller blob represents the Thursday evening I wrote down “dead zone of concentration.” The bigger blob is the entire Saturday when I recorded “all day distracted by grief and confusion.” Through this type of work, I am attempting to keep the human role from getting lost. The over-caffeinated, wobbly hands that created this design are visible in the marks.
A bit of the process of visualizing my distractions.
Two weeks of data on how I use my phone. I enjoy that this design looks somewhat like space, as my phone tends to make me feel like a disconnected alien. After creating this, I removed email from my phone—I invite you to try this as well, it is delightful.
I tracked a week of whining. A very personal representation of real life over a small amount of time. It is subjective, drawn, human—and the content would be vastly different if I repeated this exercise.
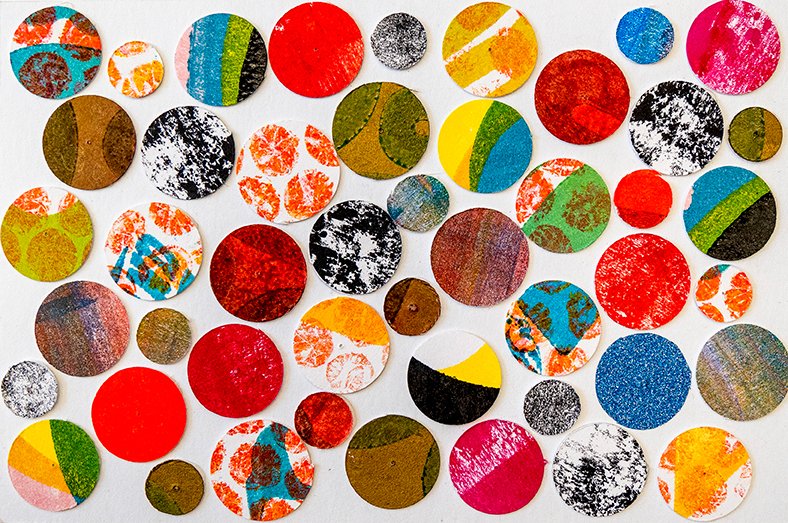
This piece shows a week of trying new things during which I intentionally tried doing and experiencing new things. The small circles indicate new things I didn’t like; the big circles show new things I did like. The circles are made from my archive of letterpress prints—except the sparkly blue circle. That is a special circle that represents presenting at a conference, a new experience that I particularly liked.
A visualization of data I don’t want to share, collected for a week. The general topics are:
purple: my personal life
blue: myself
orange: others
green: school
yellow: client work
Visualizing the data I don’t want to share. Even the timelapse captures a few pauses for thinking and slow engagement with the data.
Data are not just numbers. Data are complex, human, messy, and real. Data can represent facts and figures, of course, but a person is always involved in the choices of which facts, what they look like, and where they get communicated. My goal in this work is to make what the audience sees undeniably human and to realign how we understand data with the subjectivities of its human nature.


